TradingView on darwin
Chart Trading, Volume Profile and other new features
Empower your trading thru darwin technology with the precision of Chart Trading perfectly integrated in TradingView.
Enter your orders with one click and monitor their progress.
You can act promptly by modifying or deleting them always keeping your graphical analyzes and market evolution under control also thanks to the volume profile.
Volume Profile
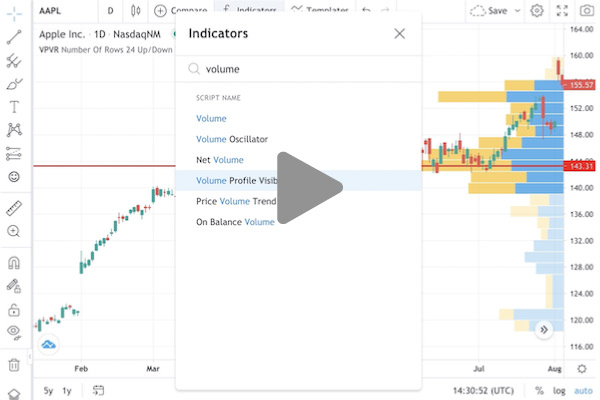
A vital tool that shows the most traded prices for a particular time period. Volume Profiles allow you to plot volume as a histogram on the price bar, so you can see the levels where you need them. You can display a volume profile for the selected range, for the session, or for the visible range.
Volume Profile is an advanced charting study that displays trading activity over a specified time period at specified price levels. The study (accounting for user defined parameters such as number of rows and time period) plots a histogram on the chart meant to reveal dominant and/or significant price levels based on volume. Essentially, Volume Profiletakes the total volume traded at a specific price level during the specified time period and divides the total volume into either buy volume or sell volume and then makes that information easily visible to the trader.
Further details
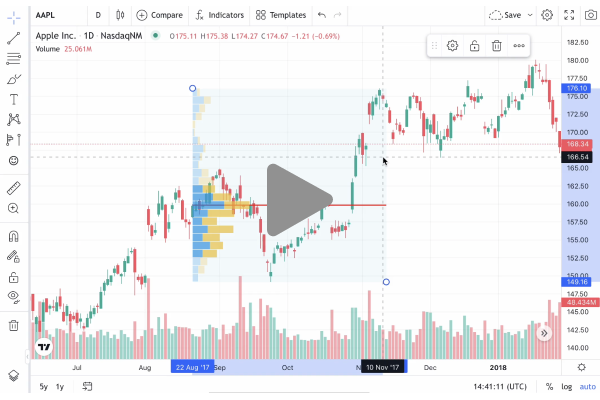
Fixed Range Volume Profile
This feature helps you specify the part of the candle to show the volume profile. The distribution of volumes by price level, applied to a determined time range, evidences the "shape" of volume profile in that range and allows for an immediate identification of the fundamental levels of the period selected.
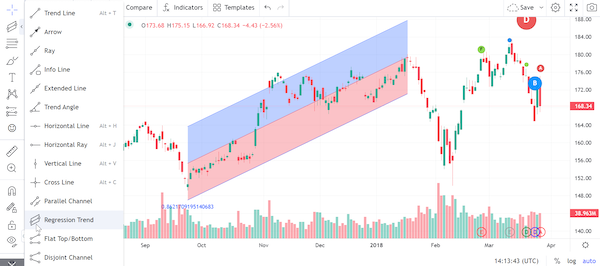
Regression Trend
Linear regression channels are a good way to identify key price levels for the future of a trend. When Trend Regression tool is selected from the side menu (among Linear Tools), two points on the chart have to be chosen, usually at the beginning and at the end of a given trend. After applying the two points, the tool automatically calculates the distribution of the underlying data and creates a channel with linear regression.
The center line (base line) is the one that directly connects the starting point with the end point. The two lower and upper limit bands are 2 standard deviations away from the central one (this value can be changed from the settings).
The linear correlation coefficient (Pearson's correlation coefficient) is displayed on the chart, unless you disable it from Style settings.
This value represents the strength and direction of the correlation, the further it is from zero, the greater the linear correlation between price and time. Although it is always a positive number because it is expressed in absolute value, the direction is clearly visible from the chart itself.
When the regression has a high correlation coefficient, it means that the price remains very close to the base line, without testing the upper and lower limits.
With this tool it is important that the period is long. In the short term, statistical correlations have a lower value and it is possible to see more erratic behaviors. Therefore, it is always important to take into consideration the temporal extension of the trend.
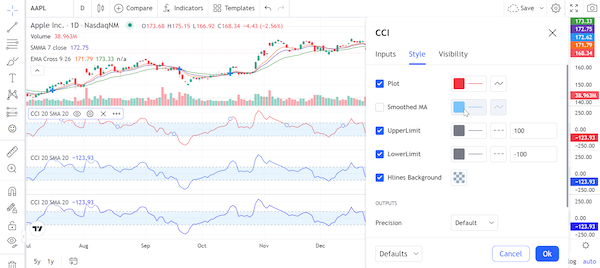
Smoothing lines added for RSI, SMA, EMA and other indicators
Smoothing indicators on RSI, SMA, EMA, Balance Volume and CCI.
From Style you can show/hide the indicator, while from Input you can decide with which values/calculation methods it will be applied.
Custom date range on the chart
Object tree
Drawing Tools — Signpost
other changes
Support for barsBack value while requesting data. This parameter allows you to request the exact amount of data of the chart, which ensures optimal operation with the data provider.
Guppy Multiple Moving Average Indicator.
Ability to change “Price/Bar ratio” programmatically. You can choose a single scale for different tickers with the API.
Using libraries with web components.
Disable auto market status widget in detail. This version allows “display_market_status” to hide the market status in a detailed widget.
Support empty and custom types in symbol search without the need to catalog each instrument as part of Stocks, CFDs, Forex, ...
Set height of all chart panes at once. his feature allows you to set the size of all the panes in a chart with a single function call.
ISet chart layout name in the widget constructor. You can pass layout name to the widget, in a similar way to how we pass layout configuration in “saved data”.
Possibility to disable save shortcut . If you don't want to save the chart, you can disable the keyboard shortcut (Ctrl + S).
Optimized chart performance with more than 100k visible bars
Mathematical operators for symbol search (“quick search”)
System requirements
You can act promptly by modifying or deleting them always keeping your graphical analyzes and market evolution under control also thanks to the volume profile.
A vital tool that shows the most traded prices for a particular time period. Volume Profiles allow you to plot volume as a histogram on the price bar, so you can see the levels where you need them. You can display a volume profile for the selected range, for the session, or for the visible range.
Volume Profile is an advanced charting study that displays trading activity over a specified time period at specified price levels. The study (accounting for user defined parameters such as number of rows and time period) plots a histogram on the chart meant to reveal dominant and/or significant price levels based on volume. Essentially, Volume Profiletakes the total volume traded at a specific price level during the specified time period and divides the total volume into either buy volume or sell volume and then makes that information easily visible to the trader.
Further details
- Point of Control (POC): The price level for the time period with the highest traded volume
- Profile High: The highest reached price level during the specified time period
- Profile Low: The lowest reached price level during the specified time period
- Value Area (VA): The range of price levels in which a specified percentage of all volume was traded during the time period
- Value Area High (VAH): The highest price level within the value area
- Value Area Low (VAL): The lowest price level within the value area
The center line (base line) is the one that directly connects the starting point with the end point. The two lower and upper limit bands are 2 standard deviations away from the central one (this value can be changed from the settings).
The linear correlation coefficient (Pearson's correlation coefficient) is displayed on the chart, unless you disable it from Style settings.
This value represents the strength and direction of the correlation, the further it is from zero, the greater the linear correlation between price and time. Although it is always a positive number because it is expressed in absolute value, the direction is clearly visible from the chart itself.
When the regression has a high correlation coefficient, it means that the price remains very close to the base line, without testing the upper and lower limits.
With this tool it is important that the period is long. In the short term, statistical correlations have a lower value and it is possible to see more erratic behaviors. Therefore, it is always important to take into consideration the temporal extension of the trend.
From Style you can show/hide the indicator, while from Input you can decide with which values/calculation methods it will be applied.
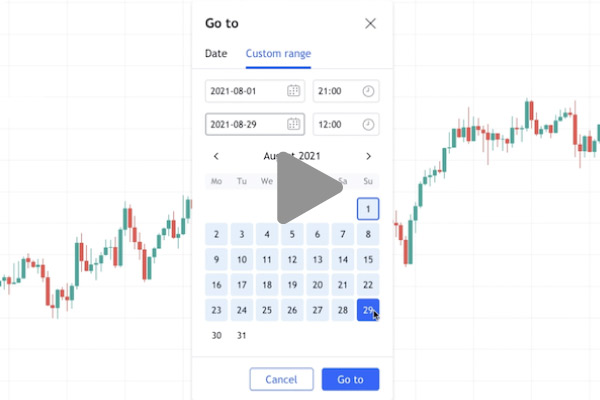
Manage time scales on your chart
You can select a specified range (day, month, year, etc.), choose a specific date on the chart, and now, finally, you can also select a custom date range. Just click on the "Go to" button, select the "Custom range" tab, and set two dates. 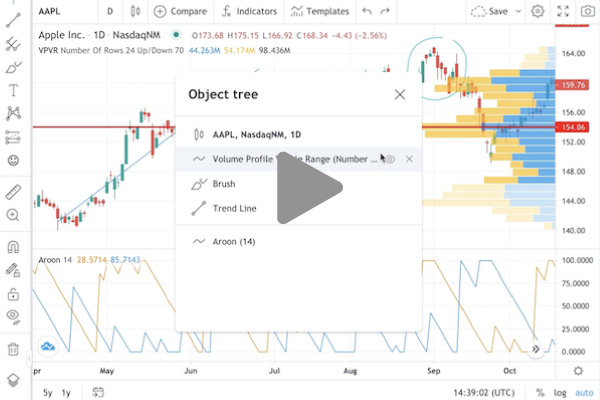
The Object tree gives you additional control over the chart’s objects.
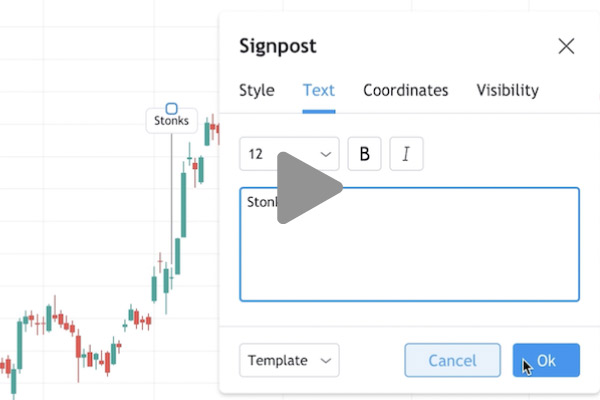
With this tool you can mark a custom event on the chart or add a comment to a section of the chart.
You can use Chart Trading, Volume Profile and all the other TradingView new features from darwin platform. Before you begin, make sure your computer meets the minimum technical specifications outlined below.
You need a 64-bit Windows version (version 10 or later) or a recent macOS version that does not integrate an NVIDIA GPU (graphics card).
Enter darwin via dGO. Installing dGo is immediate and easy, fast and safe for either Windows or macOS.
You need a 64-bit Windows version (version 10 or later) or a recent macOS version that does not integrate an NVIDIA GPU (graphics card).
Enter darwin via dGO. Installing dGo is immediate and easy, fast and safe for either Windows or macOS.